Visualizing Abia's Erosion Landscape
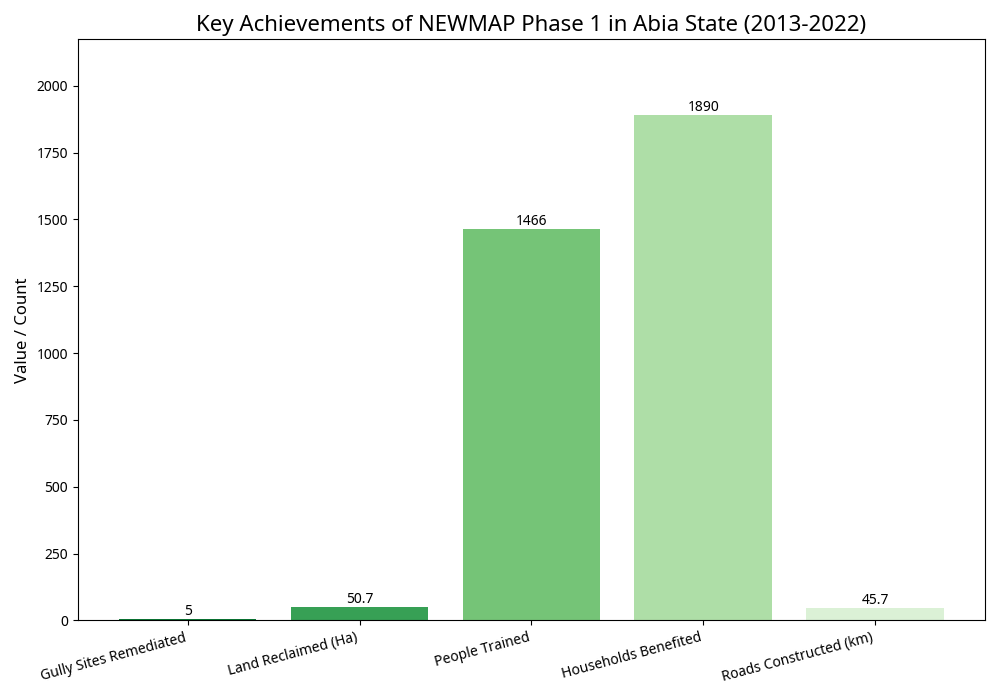
While a fully interactive map requires dynamic capabilities beyond a static site, these visualizations provide key insights into the distribution and status of erosion sites across Abia State based on the latest NEWMAP-EIB data.
Prioritized Gully Sites & Coordinates

This chart displays the top priority gully erosion sites identified for intervention under NEWMAP-EIB, ranked by urgency and including their precise georeferenced coordinates.
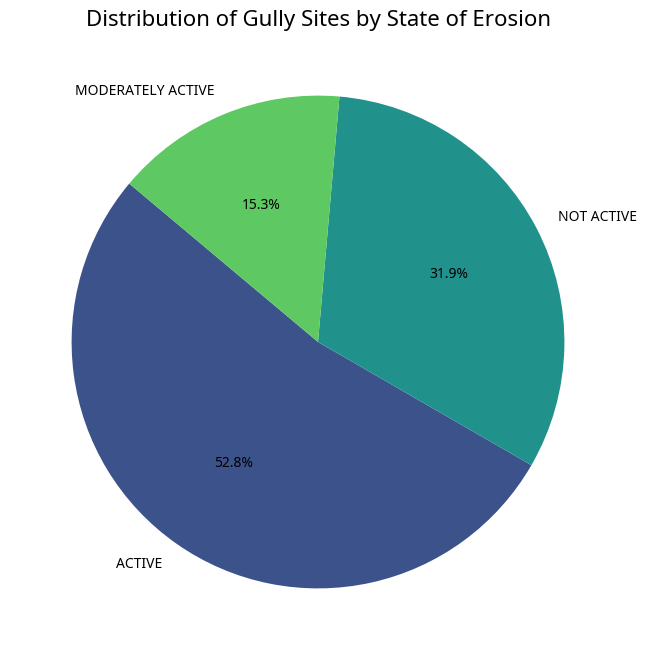
Distribution by State of Erosion

This chart illustrates the proportion of identified gully sites categorized by their current activity level (Active, Moderately Active, Not Active), highlighting the scale of ongoing erosion challenges.
Total Identified Sites per LGA

This visualization shows the geographical distribution of all identified gully sites across the participating Local Government Areas (LGAs) in Abia State.
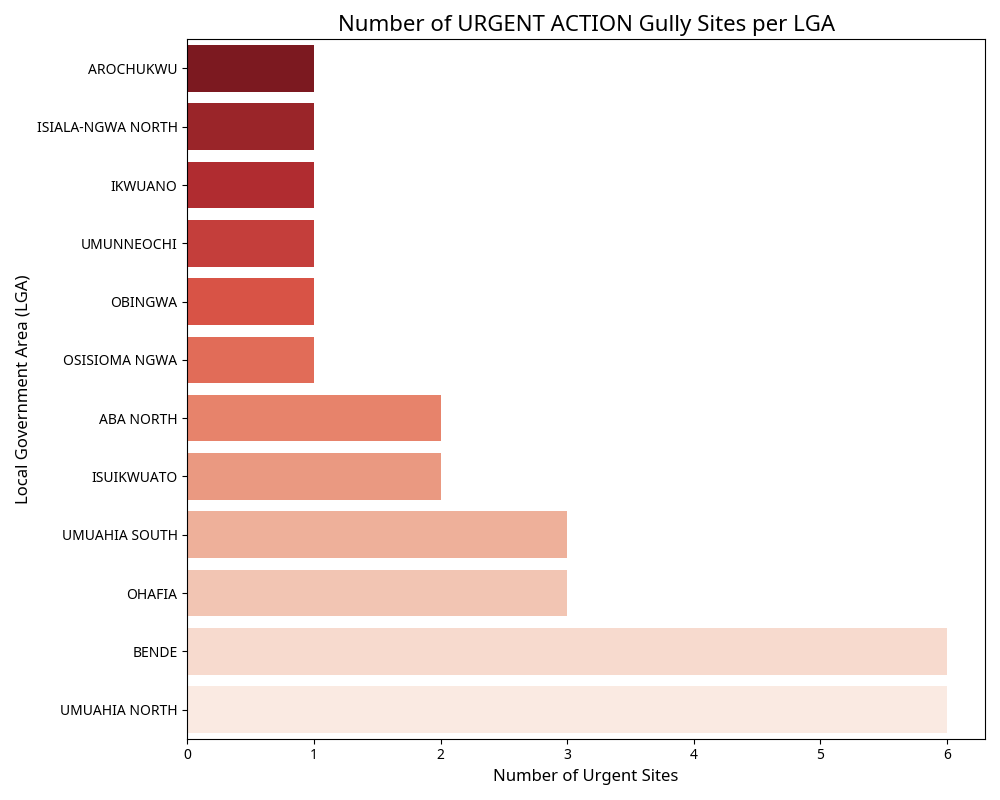
Urgent Action Sites per LGA

Focusing on the most critical areas, this chart details the number of sites classified as requiring urgent action within each LGA.
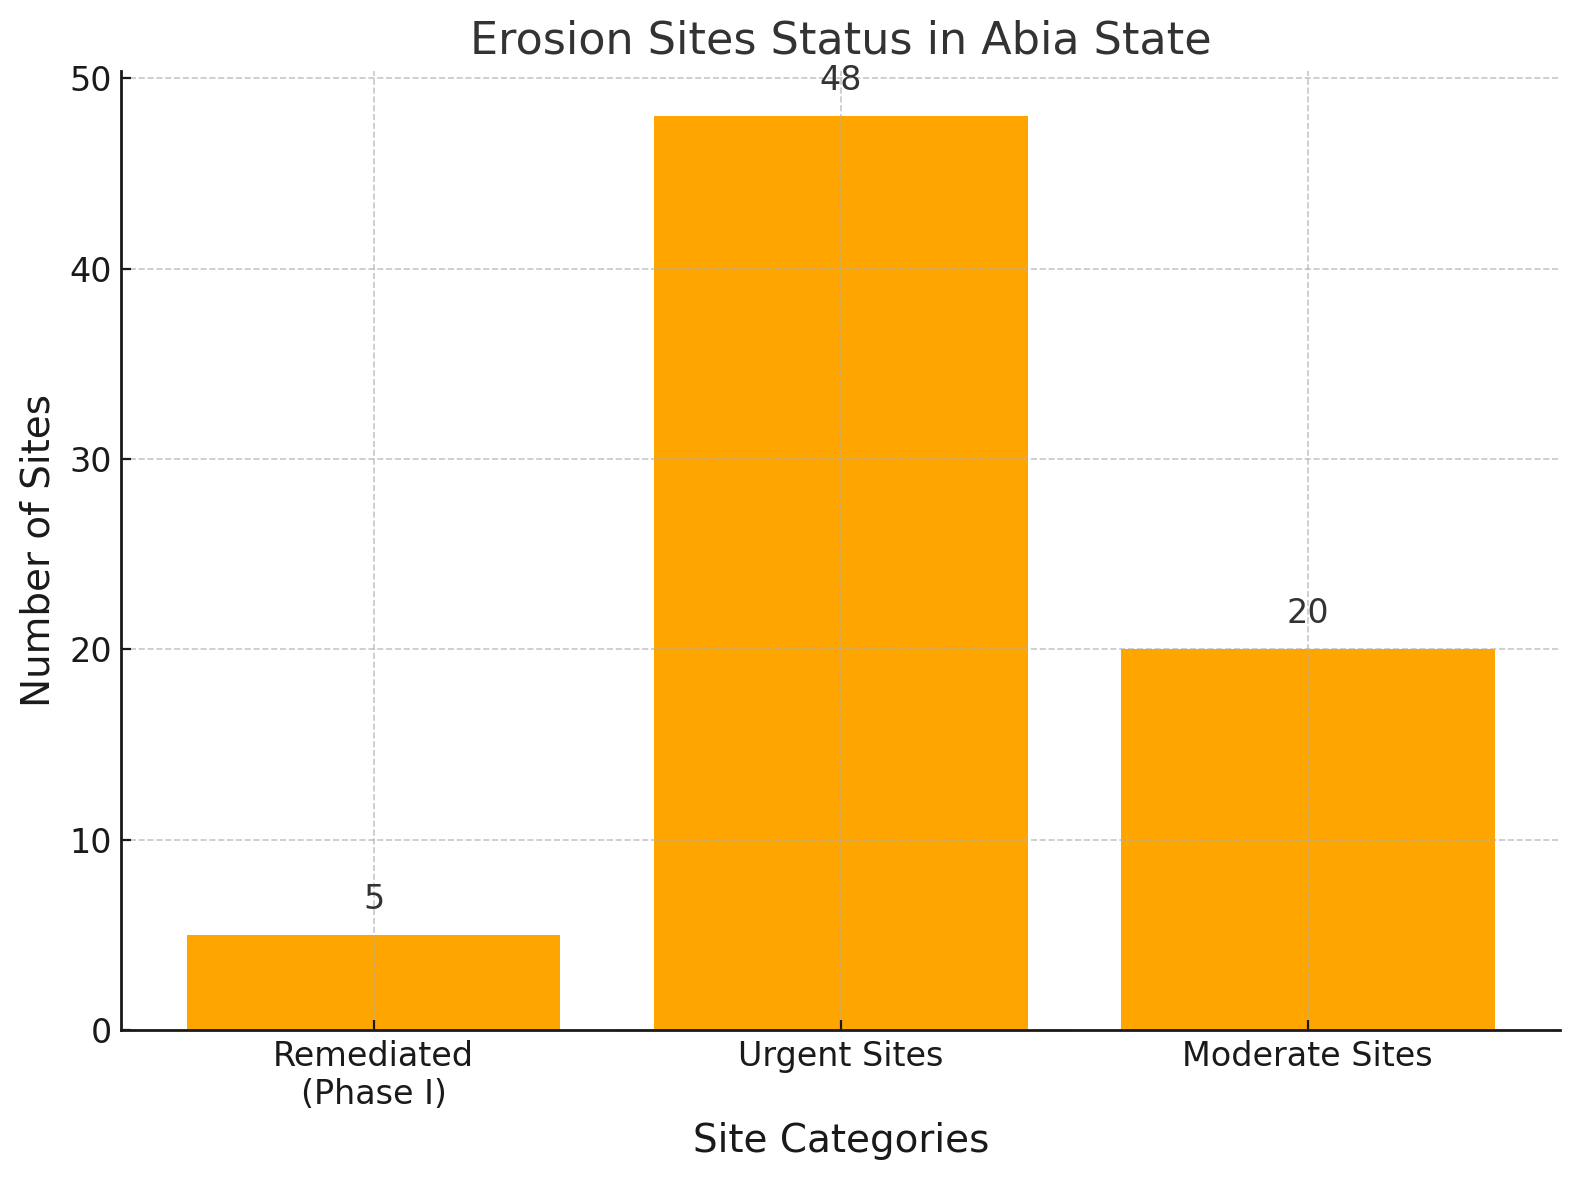
Erosion Sites Status Overview

This chart provides an overview of the status of identified erosion sites, showing the number remediated in Phase I alongside those categorized as Urgent or Moderate in the current phase.
These static maps provide a snapshot of the project's scope and priorities. For more detailed data, please visit the Data Room.